The Diagnosis Statistics (figure 45) gives the practice information about how many times each diagnosis has been used in the practice, and what percentage of usage that equals. This is important because some insurance carriers gather statistics about the practice, and if a diagnosis is utilized too frequently, then it will trigger red flags that could lead to an audit of the practice.
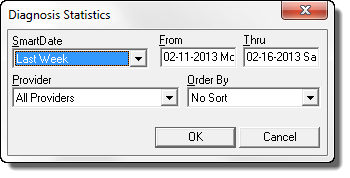
Click on the Diagnosis Statistics selection to bring up the Selection Pop-Up (figure 44).
Figure 44
Choose the options for the report; date, provider and sort order. Then click OK.
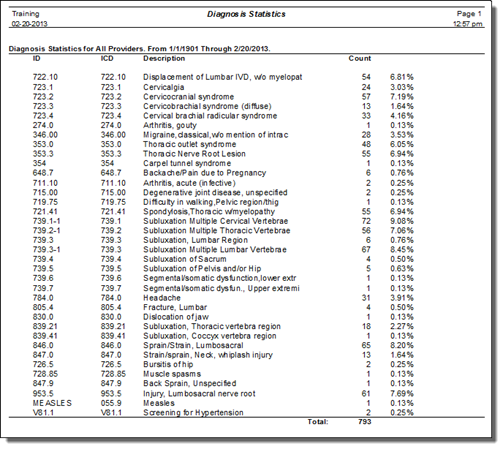
Figure 45